This is the second post in a series talking about creating real time logging using chrome dev tools and real time communication libraries such as signalr. The first post focused on the server-side portion of the setup. This post will focus on creating the chrome devtools plugin which will display the logging information from the server.
About chrome plugins
If you know html/javscript/css, creating a chrome extension is actually really easy. The only gripe I have is there seems to be no way to inspect dev tools extension panels.But, you can get around that by sending errors from window.onerror and try/catch to the inspected window or background page console. Another thing to keep in mind is certain features will not work if you don’t have the appropriate permissions in the plugin configuration. I strongly suggest reading the chrome developer documentation for a better understanding of how devtools plugins work.
Creating the Plugin
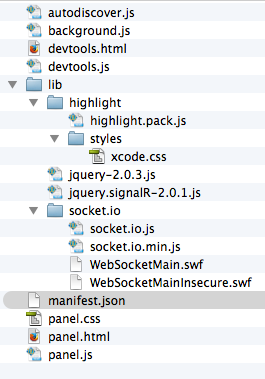
I will start off with a layout of the plugin files in the file system and explain each file in a logical order.

Plugin Manifest
This file tells chrome about the plugin and the various files it needs to work correctly.
{
  "manifest_version": 2,
  "name": "Real Time Logger",
  "description": "This extension allows applications to send logs to client without embedded scripts",
  "version": "1.0",
  "background":{
  	"persistent": true,
    "scripts": ["lib/jquery-2.0.3.js","lib/jquery.signalR-2.0.1.js","background.js"]
  },
  "permissions": [
    "tabs", "http://*/*", "https://*/*"
  ],
  "devtools_page": "devtools.html"
}
The “background” directive will instruct chrome to load an html page and include the three js files as scripts. Alternatively, you can create your own background.html and include the scripts yourself. The permissions control access to otherwise limited capabilities of the chrome extensions api. The devtools_page is where the plugin will create the panel used by the plugin to display the log information.
Background.js
This is the workhorse of the plugin. It will maintain all the connections to the server, receive the log messages and pass them out to the respective panels to be displayed.
var connectionlib = {
	signalr: function(){
		var connection;
		return {
			init: function(settings, handler){
					 var url = settings['baseurl'] + settings['url'];
					 connection = $.hubConnection(url, { useDefaultPath: false });
					 var proxy = connection.createHubProxy(settings['hub']);
					 proxy.on('onSql', function(sql) {
						handler(sql);
					 });

					 connection.start();
			},
			stop: function(){
				connection.stop();
			}
		}
	}
}


chrome.runtime.onConnect.addListener(function (port) {

     chrome.tabs.executeScript(parseInt(port.name),{ file: 'autodiscover.js' },function(result){

     	var options = result[0].split(";");
     	var settings = {};
     	for(var o in options){
     		var s = options[o].split('=');
     		settings[s[0]] = s[1];
     	}

     	var lib = connectionlib[settings['library']]();
     	lib.init(settings,function(sql){
     		port.postMessage(sql);
     	});

     });


      port.onDisconnect.addListener(function(p) {
    		lib.stop();
      });

});
The connectionlib object is just a simple way to handle support for multiple libraries. The listener function is where all the magic happens. For every dev tools panel which connects to it, it will attempt to detect if the inspected page supports real time logging and connect to it.
autodiscover.js
The background page will inject this code into the inspected window and if the it finds a meta tag with realtime logging configuration, it will send that configuration back to the background page.
var autoDiscover = document.querySelector('meta[name="real-time-log"][content]');
if(autoDiscover){
		autoDiscover.content + ';baseurl=' + window.location.protocol + '//'+ window.location.host
}
When I thought of ways the dev tools plugin could discover logging capabilities the first thing that came to my mind was meta tags. However, this can be achieved using custom headers or some other content in the page. Another option is to not use automatic discovery at all and opt for entering the url in the panel.
devtools.js
This code is very simple. All it does is create our logging panel when devtools opens.
chrome.devtools.panels.create("Real Time Log",
    "icon.png",
    "Panel.html",
    function(panel) {
      // code invoked on panel creation
    }
);
panel.js
This code will connect to the background page and wait for any incoming logs to output.
var log = document.getElementById('log');
var clear = document.getElementById('clear');

clear.addEventListener("click", function(){
	log.innerHTML = '';
});

var backgroundConnection = chrome.runtime.connect({
    name: ''+ chrome.devtools.inspectedWindow.tabId + ''
});

backgroundConnection.onMessage.addListener(function(sql){
	var li = document.createElement('pre');
	li.innerHTML =  hljs.highlight('sql', sql).value;
	log.appendChild(li);
});
panel.html
This page contains the elements the user can see an interact with in the devtools panel. The log element will display all log messages. Highlight will be used for syntax highlighting in the messages.
<html>
<head>
<link rel="stylesheet" href="lib/highlight/styles/xcode.css" />
<link rel="stylesheet" href="panel.css" />
</head>
<body>
<button id="clear">Clear</button>
<div id="log"></div>
<script src="lib/highlight/highlight.pack.js"></script>
<script src="panel.js"></script>
</body>
</html>
panel.css
This is some basic css for presenting the logs
pre {
	border-bottom:#cccccc 1px solid;
	padding-bottom:3px;
}
panel.css
This is some basic css for presenting the logs
pre {
	border-bottom:#cccccc 1px solid;
	padding-bottom:3px;
}
devtools.html
All this file does is include the devtools.js
<script src="devtools.js"></script>
What I have described so far in my two posts is really all you need for a basic implementation of this real time logging concept. You can download highlight.js from http://highlightjs.org/. I was only able to get the signalR client files by creating a dummy project and adding it to the project via nuget.
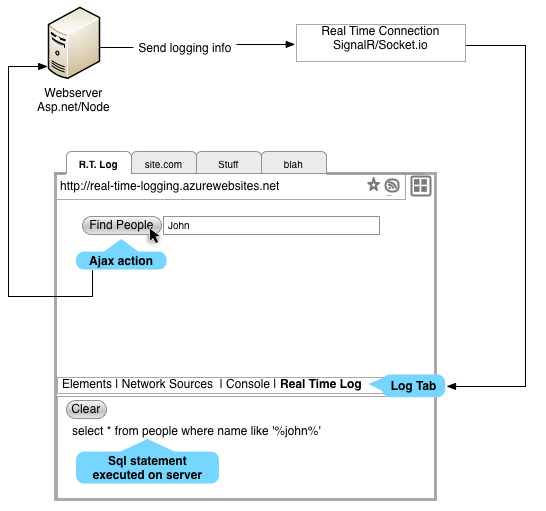
General Overview of the entire solution:

The code in this post is a really basic get your hands dirty example. I created a github project which I will use to take the idea further. You are free to download the plugin, try it out and send pull requests if you wish. The project readme explains how to install and use the plugin.