Asp.net Core Containers with multi-stage Docker builds


This short post introduces the concept of multi-stage Docker builds for ASP.NET Core applications.

Microsoft maintains two asp.net core images on Docker hub. The following are descriptions from the Docker hub pages:

microsoft/aspnetcore-build

This repository contains images that are used to compile/publish ASP.NET Core applications inside the container. This is different to compiling an ASP.NET Core application and then adding the compiled output to an image, which is what you would do when using the microsoft/aspnetcore image. These Dockerfiles use the microsoft/dotnet image as its base.

microsoft/aspnetcore

This repository contains images for running published ASP.NET Core applications. These images use the microsoft/dotnet image as its base. These images contain the runtime only. Use microsoft/aspnetcore-build to build ASP.NET Core apps inside the container.

Before multi-stage builds there were basically 2 options. The first option was to install the SDK on your computer or CI machine, build and package your app then build a container based on the ASP.NET Core runtime and package output. The second option was to use a container with the SDK already baked in, mount that container to a volume on your host, build and publish your app to that volume and finally, build a container based on the ASP.NET Core runtime and package output.

Multi-Stage Builds

Multi-stage builds allow developers to build their ASP.NET core projects in aspnetcore-build and copy the published output to an aspnetcore container in one Docker file without unnecessarily increasing the size of the final container. The following Docker file was taken from one of my Github projects.

FROM microsoft/aspnetcore-build:2.0.0-preview2 as builder
COPY . /workspace
WORKDIR /workspace
RUN mkdir /publish
RUN dotnet publish -o /publish src/aspnet-core-sample/aspnet-core-sample.csproj

FROM microsoft/aspnetcore:2.0.0-preview2
EXPOSE 80/tcp
COPY --from=builder /publish /app
WORKDIR /app
ENTRYPOINT ["dotnet", "aspnet-core-sample.dll"]

A multi-stage build Docker file is simply a Docker file containing multiple FROM clauses. Each FROM clause is referred to as a stage. Traditionally, these stages would have been separate Docker files. This feature allows you to chain multiple steps in the image build process without complex glue scripts and CI processes.

You can read more about multi-stage builds on the Docker blog. You can also take a look at my sample Dockerfile on Github.

Raspberry Pi Security Camera


This post is meant as a guide for setting up a Raspberry Pi as a security camera. First, I will tell you what hardware you need and how to setup it up, then I will walk you through configuring the software, then finally how to view and archive your security footage. I used a Raspberry Pi model B because i had one lying around but you can do this with any Raspberry Pi that has the camera connector. I will assume you don’t have any of the items needed to get this done so if you do please use what you have. Otherwise, I encourage you to be adventurous and get upgraded versions.

What you need before you start

  • Raspberry Pi Model B
  • SD Card for Raspberry Pi
  • Wifi Adapter for Raspberry Pi
  • Charger for Raspberry Pi
  • HDMI Cable ( For Raspberry Pi Setup)
  • TV/Monitor with HDMI Input ( For Raspberry Pi Setup)
  • Very long charging cord for Raspberry Pi
  • Keyboard/mouse to setup Raspberry Pi ( For Raspberry Pi Setup)
    • wireless 2 in 1 works great for Pi with only 2 usb ports because you need one for wifi
  • Raspberry Pi Camera
  • Raspberry Pi Case
  • Standard Drill (optional for mounting Pi)
  • Mount (thing about where you want to mount the camera)

Setting up the Raspberry Pi

Place the Raspberry Pi into the case before making any connections. If your case doesn’t have a port for the camera don’t close it just yet.

61kmfjpj9hl-_sl1363_

You will connect the keyboard/mouse, power adapter, camera, wifi adapter, HDMI cable to the tv/monitor and SD Card setup with NOOBS to your Raspberry Pi. Use the NOOBS setup instructions on the official Raspberry site to setup Raspbian. You can find a great video walkthrough on youtube.

Setting up SSH

After Raspbian is setup your pi should boot up to the desktop. Everything from this point on will be done in the terminal. When the camera is mounted it will not have the keyboard/mouse or monitor connected. Therefore, we need to setup ssh to access the device. Please follow the official Raspberry Pi instructions for enabling ssh.

Setting up Motion

Motion is the software you will use to monitor the feed and take images and video whenever it detects movement. I find this more efficient than 24/7 full motion video. Before you setup motion please setup your camera and verify that it is working. Here is a youtube video that will guide you though the process. The next step is to install and configure motion. Please follow the instructions on this youtube video.

Mounting  the Camera

If everything when well you should have a Raspberry pi + camera with motion installed and capturing movement. You can get creative about how you mount the Pi but I decided to drill holes in the Pi case for my setup. First drill a hole into the top facing part of the case for your camera. It has to be just right for the camera to fit through. Place it slightly down from center on the side of the camera port so you have enough space to spread the camera cable once the case is closed. The extra cable should help the camera to stay in place.

imag0223

I used the above case because I had it lying around. You will notice I spray painted it but I still have all the other ports visible.  For that reason I recommend getting a fully enclosed case.

61kmfjpj9hl-_sl1363_

Mounting the Case

There are many different ways to do this last part but by now you should have a closed raspberry pi with camera hidden inside the case. The easiest way to do this is simply put the pi case in a universal cellphone mount.

I went a step further and screwed the pi directly on the mount. I bought the following mount because it had the longest most flexible arm I could find. It is great if you need to mount it in an awkward position.

41jk2jnmiel-_sl1000_

Break off the plastic part which is meant to hold the device. You will be left with the screw that goes directly into the tip of the mount. remove the screw and put it to the side. Remove the raspberry pi from the case and drill a hole into the back of the case. The hole should be big enough for the screw to fit through. Then screw the back of the case directly to the mount and put the Raspberry Pi back together.

imag0229

Once the case is mounted and is facing the area you want to monitor, open the browser from a computer on your network and navigate to the webpage hosted on the Pi which allows you to see live footage. Please see the section on setting up motion if you are not sure how to get to it.

Accessing Captured Images and Video

All images are stored in /var/lib/motion on the Raspberry Pi. You can copy them to your local computer with SCP, setup a samba/nfs file share that other computers on your network can mount or sync the files to cloud storage.

My next post will walk you through syncing the files to azure storage and deleting files over a certain age. The third post will either create from scratch or modify an existing ui to browse  and search the images and video uploaded to azure. We will create a full text index for our media with the help of the Azure Cognitive API.


Using Visual Studio Code to Write Articles and Static Sites


Visual Studio Code is a lightweight cross platform code editor which provides syntax highlighting, debugging and intellisense support for various programming languages. When I heard about it my initial thought was “Great another editor”. It turned out to be great for Node.js editing because of its awesome Node.js debugger. But I won’t go into that in this post.

One thing you might not know about Visual Studio Code is its great markdown editor and preview feature. For people who use static site generators or write articles in markdown, Visual Studio Code offers a great one stop shop for writing and previewing static content and markup. The built in source control support also allows you to save your content, code and other site assets to a git repository.

Let us walk through creating a static site using Go Hugo (Static Site Generator) and Visual Studio Code.

Installation

Please follow the instructions for installing Go Hugo here. If you are on a Mac then it can use homebrew to install it.

shell> brew install hugo

Please follow the instructions for installing Visual Studio Code here.

Creating the Project 

Create your static site using the hugo new site command and initialize git for source control.

shell> hugo new site ~/staticsite 
shell> cd ~/staticsite
shell> git init
shell> git add .

The staticsite folder should now contain a stub for your new site and git repository.  The git add command will allow git to track the files initially generated by the hugo.

Opening the project in Visual Studio Code

While still in the staticsite folder run the following command to open the project in Visual Studio Code.

shell> code .

Visual studio code should open to reveal a screen similar to the following screenshot.

staticsite

The content folder is the designated location for your markdown files. The static folder is reserved for static assets such as your javascript and css. It is important to understand that the files in these folders are not what is uploaded to the webserver. When you generate your static site, it will process  and copy the generated content along with static assets to the public folder. The public folder will be created the first time you generate the site. To understand more about using hugo to generate static sites I encourage you to view their documentation.

Adding a new content file

Back in the command shell (hoping maybe I or someone will figure out a way to add hugo commands to visual studio code). Run the following command to create your first page.

shell> hugo new /vscode-articles/creating-static-sites.md

The above command will create a folder called vscode-articles in the content folder then create a file called creating-static-sites.md in that folder. Your visual studio code window should look similar to the following screenshot.

staticsite add content

Editing Content

Open the newly created content file to begin editing it. The file will contain some meta data commonly referred to as front matter in the static site world. The data in the front matter is used to customize the content generation process. You can begin writing your content below the front matter.

Paste in some markdown content then open up the split editor. Once the split editor is open click on the open preview button for one of the windows. One of your windows will have your content and the other will have your markdown preview. Your window should look similar to the following screenshot.

article-with-preview

For those who are wondering, the split editor and preview buttons are to the top right of the editor window. The great thing about the split editor is the preview window updates as you type.

Adding Images

Adding images to your content can be a bit tricky if you don’t use a cdn or external url. Hugo was originally designed to have all static content including images in the static folder. The content of the static folder is copied to the root of your published site. The problem with that approach is markdown preview will not be able to find your images since. I also prefer to store my images together with related content.  So great care must be taken when configuring your site because the site url hierarchy is mostly determined by the content folder structure. I have gotten my images to display both in the preview editor and on the generated site by updating the hugo configuration file.

Open config.toml and add the following two options

uglyurls = true

Create a folder called images in the vscode-articles folder and add an image to it. Then, edit your markdown to include the image. Your window should appear similar to the following screenshot where the preview window also displays the image.

article-with-image

This method will only display content images that are rendered on single pages. It will not work on list pages. So if you don’t mind not seeing your images in markdown preview then you can add your images to the static folder and link to them relative to the root of the site.

![VS Code Static Site](/images/staticsite.png)

Preview the Entire Static Site

Before you render the site you must add a theme. Think of the theme as a master template for your pages. It will contain the headers, footers, links to static assets such as css and other customizations for the site. There are quite a few hugo templates in the wild so you can run this command which will download a list curated by the hugo author.

shell> git clone --recursive https://github.com/spf13/hugoThemes themes

Hugo comes with a development server that allows you to preview your site locally before it is published. To test your new static site run the following command

shell> hugo server --theme=hyde --buildDrafts

The above command will generate the site and print out the url of the development server. If you visit the url http://localhost:1313/vscode-articles/creating-static-sites.html  you should see something similar to the following screenshot.

preview site

When you are ready to publish your content you will set draft to false in the front matter of your content file then generate the site using the hugo command.


shell> hugo
0 draft content
0 future content
1 pages created
0 paginator pages created
0 tags created
0 categories created
in 52 ms

Once the site is generated you can upload the contents of the public folder to your host. My static site is hosted on azure websites so I copy the public folder to dropbox and sync dropbox with my azure website to perform updates. You could always use a ci server to watch your git repo and update your site after git commits.

Elasticsearch In Azure PAAS [Worker Roles]


The Preamble
A few months ago I came across the free law project and its awesome dataset of court decisions from around the country. I think it is amazing that everyday people can have easy and free access to a searchable index of court decisions. In addition to their front end search page and search api, they allow more advanced people to download their dataset using their bulk api. People are doing some pretty interesting things with this dataset. I even came across what looked like a decision prediction engine. I decided to use the dataset to create my own search index because it was the perfect opportunity to play around with Elasticsearch (a distributed search index). Note that I have no intention of replacing the existing functionality provided on courtlistener.com. This is more of an academic exercise for me.

Getting and processing the data
The bulk api outputs a compressed file containing opinions in xml format. I started off by creating a bash script which accepts one of the compressed files outputted by the bulk api, iterates over the opinions and get them ready for import into the search index. Creating the script proved challenging at first because I did not have enough disk space available on my MBP to store and processed the 12gb file. I then realized that i have tons of space available to me in Azure storage so I created an Azure ubuntu vm with an attached disk to test my processing script.

Choosing a platform
By the time I was done with the script I started thinking about how I would get Elasticsearch stood up on multiple nodes with discovery enabled. I came across the Elasticsearch Cloud Azure Plugin which is maintained by Elasticsearch. This plugin uses the Azure Management Api for discovery and the Azure Storage api for snapshots. I started implementing it but then I thought maybe it didn’t have to be this hard. Why should I have to be messing with certificate stores and all that when the service runtime api provides all the info I need for discovery. This is when I decided to focus my efforts on getting this going in the Azure PAAS environment. I came up with a plan of attack to get things going:

  • Get Java Installed
  • Persistent Storage for data
  • Persistent Storage for snapshots
  • Configuring and running Elasticsearch
  • A discovery plugin based on the runtime api
  • Internal load balanced endpoints
  • Logging

At this point I was confident I could get everything done using Azure Worker roles.

Elasticsearch PAAS

Setting up the project
Getting Java installed was a no brainer. All I needed to do was create a startup script which downloaded and run the installer. After a few bruises and a couple of hours into creating the startup script as a batch file, I decided it didn’t make sense to be battling with batch scripts when I had access to the full .net framework and a much more modern scripting engine in powershell. I also decided that I should include the java installer in the project instead of downloading it because it made more sense to take that hit when uploading the package instead of during startup. Once I had a working powershell script which ensured java was installed, all I needed to do was configure and run Elasticsearch.

Elastic PAAS Solution

Persistent Storage
Azure PAAS is a mostly stateless environment so applications must point to some external persistent storage. I was thinking that I could attach a vhd and mount it on my worker instances but eventually decided to try the new Azure File service with SMB support. It turns out that someone had already thought of this and released some code which made it very easy to mount Azure file storage shares as mapped drives in worker roles. With that, my persisted storage problem was solved. Elasticsearch could store its data on what would look like just another local drive. It is interesting to note that this is the only aspect of this solution I could not test on the Azure Emulator. So the code uses resource directories for storage when in the emulator.

Configuring and Running Elasticsearch
Elasticsearch does not have an installer per se. Instead, you use platform specific scripts to run it or install it as a service. So all I needed to do in the RoleEntryPoint was start the process and wait for it to exit. Also, when then RoleEntryPoint exists I can have it stop the process. The Elasticsearch configuration can be placed in either a .yml or .json file. I didn’t find out about the .json file till after so I pulled in a project called YamlDotNet to programmatically write configuration values such as the node name (instance id) that would only be available in the RoleEntryPoint. The deployment starts off with a base .yml, merges the base config with its own custom values in memory and writes the merged file to the final Elasticsearch config directory.

A discovery plugin based on the runtime api
I thought the discovery plugin would have been a walk in the park until I encountered a big problem. The Runtime API for java is supported by named pipes. Unfortunately, the named pipe is only available when using a ProgramEntryPoint in the service definition (I wish they would change that or at least make it configurable in the service definition). At this point I thought of moving the entire project to eclipse or using a console application as a ProgramEntryPoint but that took away my ability to simply run and debug in the emulator. Then, I thought if they were already using IPC for the java service runtime then it should be good enough for my solution. All I had to do was setup a mini server in the RoleEntryPoint that the java discovery plugin could communicate with. I did a proof of concept for both TCP and named pipes but eventually decided on named pipes because it was simpler. So with a working named pipes server answering all the questions about the state of the cloud service and the persistent storage for both data and snapshots abstracted away I was able to remove the dependency on the azure api for java in my plugin project.

Internal load balanced endpoints
My goal for this solution is to not expose the Elasticsearch cluster publicly but rather create a WebRole with a custom ui and or another WorkerRole which exposes a custom api to interact with the elasticsearch index. Looking at the service definition and reading around the internet it seems that I can’t declare an internal load balanced endpoint which can only be accessed by my public facing roles. It seems like my only option is to write a thin layer which cycles through or returns random node endpoints from the Elasticsearch cluster.

Logging
Elasticsearch is currently logging to a resource folder on the role, but I would really like to ship the logs somewhere. I am thinking that I can somehow hookup Elasticsearch logging to the diagnostic trace store which gets shipped to Azure storage or simply mount another Azure File share dedicated to logging. I also plan to read up on Logstash but I am not sure what value it would provide to my solution.

Additional Thoughts
Once I have all the configuration pieces in place, publishing this service will be super easy. With the click of a button (or two) I would have a private Elasticsearch cluster and a public facing website/api for interacting with it. I already have a script which will allow me to bootstrap the data but I have not thought of how to integrate it into the deployment workflow. The other challenge is scaling Elasticsearch. Scaling Elasticsearch is not as straight forward as adding more identical nodes to something such as a web application. You really have to put some thought into it. For this project I am thinking that the data, once bootstrapped, would be mostly read only. Therefore, the requirements will differ from other clusters. For example, I can have a set of main data nodes on one WorkerRole and a set of replica only nodes (need to read up on this) in another WorkerRole configured with autoscaling.

Conclusion
Thanks for taking the time to read my random stuff. The code for the project inspired by this proof of concept can be found on Github: https://github.com/garvincasimir/Elasticsearch-Azure-PAAS

Real time logs with Chrome dev tools and signalr part 2


This is the second post in a series talking about creating real time logging using chrome dev tools and real time communication libraries such as signalr. The first post focused on the server-side portion of the setup. This post will focus on creating the chrome devtools plugin which will display the logging information from the server.

About chrome plugins
If you know html/javscript/css, creating a chrome extension is actually really easy. The only gripe I have is there seems to be no way to inspect dev tools extension panels.But, you can get around that by sending errors from window.onerror and try/catch to the inspected window or background page console. Another thing to keep in mind is certain features will not work if you don’t have the appropriate permissions in the plugin configuration. I strongly suggest reading the chrome developer documentation for a better understanding of how devtools plugins work.

Creating the Plugin
I will start off with a layout of the plugin files in the file system and explain each file in a logical order.
Plugin layout

Plugin Manifest
This file tells chrome about the plugin and the various files it needs to work correctly.

{
  "manifest_version": 2,
  "name": "Real Time Logger",
  "description": "This extension allows applications to send logs to client without embedded scripts",
  "version": "1.0",
  "background":{
  	"persistent": true,
    "scripts": ["lib/jquery-2.0.3.js","lib/jquery.signalR-2.0.1.js","background.js"]
  },
  "permissions": [
    "tabs", "http://*/*", "https://*/*"
  ],
  "devtools_page": "devtools.html"
}

The “background” directive will instruct chrome to load an html page and include the three js files as scripts. Alternatively, you can create your own background.html and include the scripts yourself. The permissions control access to otherwise limited capabilities of the chrome extensions api. The devtools_page is where the plugin will create the panel used by the plugin to display the log information.

Background.js
This is the workhorse of the plugin. It will maintain all the connections to the server, receive the log messages and pass them out to the respective panels to be displayed.

var connectionlib = {
	signalr: function(){
		var connection;
		return {
			init: function(settings, handler){
					 var url = settings['baseurl'] + settings['url'];
					 connection = $.hubConnection(url, { useDefaultPath: false });
					 var proxy = connection.createHubProxy(settings['hub']);
					 proxy.on('onSql', function(sql) {
						handler(sql);
					 });
	
					 connection.start();
			},
			stop: function(){
				connection.stop();
			}
		}
	}
}


chrome.runtime.onConnect.addListener(function (port) {

     chrome.tabs.executeScript(parseInt(port.name),{ file: 'autodiscover.js' },function(result){

     	var options = result[0].split(";");
     	var settings = {};
     	for(var o in options){
     		var s = options[o].split('=');
     		settings[s[0]] = s[1];
     	}
     	
     	var lib = connectionlib[settings['library']]();
     	lib.init(settings,function(sql){
     		port.postMessage(sql);
     	});
     	
     });

   	  
      port.onDisconnect.addListener(function(p) {
    		lib.stop();
      });
 
});

The connectionlib object is just a simple way to handle support for multiple libraries. The listener function is where all the magic happens. For every dev tools panel which connects to it, it will attempt to detect if the inspected page supports real time logging and connect to it.

autodiscover.js
The background page will inject this code into the inspected window and if the it finds a meta tag with realtime logging configuration, it will send that configuration back to the background page.

var autoDiscover = document.querySelector('meta[name="real-time-log"][content]');
if(autoDiscover){
		autoDiscover.content + ';baseurl=' + window.location.protocol + '//'+ window.location.host
}

When I thought of ways the dev tools plugin could discover logging capabilities the first thing that came to my mind was meta tags. However, this can be achieved using custom headers or some other content in the page. Another option is to not use automatic discovery at all and opt for entering the url in the panel.

devtools.js
This code is very simple. All it does is create our logging panel when devtools opens.

chrome.devtools.panels.create("Real Time Log",
    "icon.png",
    "Panel.html",
    function(panel) {
      // code invoked on panel creation
    }
);

panel.js
This code will connect to the background page and wait for any incoming logs to output.

var log = document.getElementById('log');
var clear = document.getElementById('clear');

clear.addEventListener("click", function(){
	log.innerHTML = '';
});

var backgroundConnection = chrome.runtime.connect({
    name: ''+ chrome.devtools.inspectedWindow.tabId + ''
});

backgroundConnection.onMessage.addListener(function(sql){
	var li = document.createElement('pre');
	li.innerHTML =  hljs.highlight('sql', sql).value;
	log.appendChild(li);
});

panel.html
This page contains the elements the user can see an interact with in the devtools panel. The log element will display all log messages. Highlight will be used for syntax highlighting in the messages.

<html>
<head>
<link rel="stylesheet" href="lib/highlight/styles/xcode.css" />
<link rel="stylesheet" href="panel.css" />
</head>
<body>
<button id="clear">Clear</button>
<div id="log"></div>
<script src="lib/highlight/highlight.pack.js"></script>
<script src="panel.js"></script>
</body>
</html>

panel.css
This is some basic css for presenting the logs

pre {
	border-bottom:#cccccc 1px solid;
	padding-bottom:3px;
}

panel.css
This is some basic css for presenting the logs

pre {
	border-bottom:#cccccc 1px solid;
	padding-bottom:3px;
}

devtools.html
All this file does is include the devtools.js

<script src="devtools.js"></script>

What I have described so far in my two posts is really all you need for a basic implementation of this real time logging concept. You can download highlight.js from http://highlightjs.org/. I was only able to get the signalR client files by creating a dummy project and adding it to the project via nuget.

General Overview of the entire solution:
Real time plugin

The code in this post is a really basic get your hands dirty example. I created a github project which I will use to take the idea further. You are free to download the plugin, try it out and send pull requests if you wish. The project readme explains how to install and use the plugin.

Real time logs with Chrome dev tools and signalr part 1


This post was created to document the process of creating a Google Chrome Dev Tools extension which will allow a web application or plugin developer to get real time log information in the browser while developing. This first post will cover creating the web application which will log information to the dev tools extension. The second post will talk about creating the dev tools extension and connecting to the application.

What is this really about?
If you visit a site like bugs.mysql.com you will notice it tells you how long it took to generate the page. In my case it said this “Page generated in 0.017 sec. using MySQL 5.6.15-enterprise-commercial-advanced-log”. There are basically two types of logs, the ones that are persisted somehow on the server and others that are sent back to the client somehow. The mysql bugs page is an example of the latter. In this post I will be talking about the sending relevant information back to the client independent of any specific requests.

Ajax has changed everything
When I did constant WordPress development, there were many times my blog/app did not behave the way it was supposed to and I had no way of seeing what was going on. I eventually created a plugin which not only outputted all the request data, it also allowed me to output arbitrary logs, warnings, errors and sql statements together with the generated page. Fast forward to today where the apps I work on are about 90% asynchronous and views are handled on the client side, it is no longer convenient to simply output some arbitrary html/javascript to the bottom of every page. To solve this problem we need two things:

  • A way to transport the debug/log information to the client
  • A way to display that debug/log information on the client side once it is received

The first can be satisfied by making use of real time protocols such as WebSockets. This will continue to report back to the client even when a request fails. The second can be satisfied by creating a dev tools extension which will receive and display the debug/log information. Again this log lives in the browser and therefore will be independent of individual page requests.

A real use case
For the past couple years I have worked with asp.net mvc and entity framework quite a bit. Two common task I have are to figure out why certain records aren’t showing up on a given screen and why a given feature is slow. Part of my process is opening up sql profiler and logging any relevant sql queries which come in from the app. With this I can see whether or not the correct filters were applied via where clauses and also how long each individual query took to run. This works ok except that it is yet another window I need to open on my already crowded screen and it isn’t always easy to target the queries I am interested in. So what if instead of opening sql profiler, my sql statements came back to a neat little console in the browser where I am working? All I would have to do is open up dev tools and I would see all the sql activity as it happened. So in effect what I am looking for is a sql profiler but in the browser. One that only shows me relevant information.

Technology options
Before I go on, please note that my chosen technologies are strictly based on the fact that I develop mostly in asp.net mvc on sql server. However, this sort of thing can be done using Node.js and Socket.io or even Mono and XSockets.NET. So although I am doing this using SignalR, my proof of concept was actually done with Node.js and Socket.io.

Implementing the server side
The real time part of this is very simple because SignalR is really easy to setup and use in an application. You won’t even break a sweat adding it after the fact. For logging the sql statements, we will make use of the new interceptor api introduced in entity framework 6.

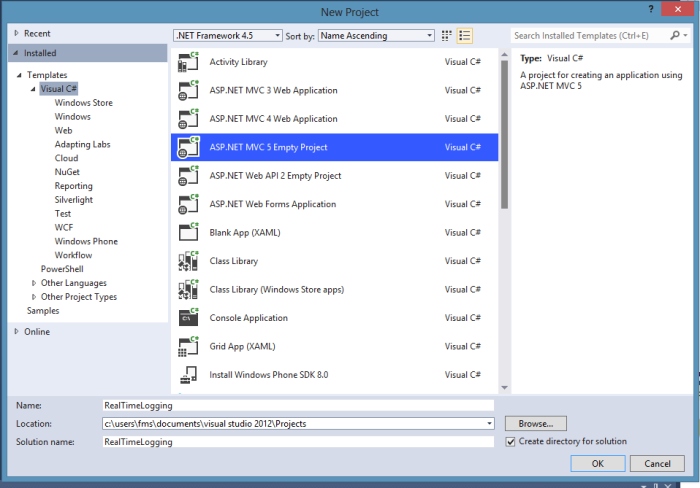
We will start off by creating a new asp.net mvc 5 project in visual studio
new app

Once the project has been created use the package manager console or the Nuget GUI to add the latest SignalR (2.0+ id:Microsoft.AspNet.SignalR), EntityFramework (6.0+) and jQuery(2.0+) to the project. Next create a new class which will act as the SignalR bootstrapper

[assembly: OwinStartup(typeof(RealTimeLogging.SignalRStartup))]
namespace RealTimeLogging
{
   
    public class SignalRStartup
    {
        public void Configuration(IAppBuilder app)
        {
            app.MapSignalR();
        }
    }

}

Next create the SignalR hub by creating a new class which extends Microsoft.AspNet.SignalR.Hub

namespace RealTimeLogging
{
    public class LoggingHub : Hub
    {
    }
}

The next class will allow us to send messages via any SignalR hub from anywhere in the application. This class can actually be used for any hub.

namespace RealTimeLogging
{
    public static class HubCaller
    {
        public static void Invoke<THub>(Action<IHubContext> action) where THub : IHub
        {
            var context = GlobalHost.ConnectionManager.GetHubContext<THub>();

            action.Invoke(context);
        }
    }
}

Next create a class which implements the IDbCommandInterceptor interface. This class will be used to intercept entity framework DbCommands and results and send the sql statements down to the client via our SignalR hub.

namespace RealTimeLogging
{
    public class StatementLogger : IDbCommandInterceptor
    {

        void IDbCommandInterceptor.NonQueryExecuted(System.Data.Common.DbCommand command, DbCommandInterceptionContext<int> interceptionContext)
        {
            SendToClient(command.CommandText);
        }

        void IDbCommandInterceptor.NonQueryExecuting(System.Data.Common.DbCommand command, DbCommandInterceptionContext<int> interceptionContext)
        {
            SendToClient(command.CommandText);
        }

        void IDbCommandInterceptor.ReaderExecuted(System.Data.Common.DbCommand command, DbCommandInterceptionContext<System.Data.Common.DbDataReader> interceptionContext)
        {
            SendToClient(command.CommandText);
        }

        void IDbCommandInterceptor.ReaderExecuting(System.Data.Common.DbCommand command, DbCommandInterceptionContext<System.Data.Common.DbDataReader> interceptionContext)
        {
            SendToClient(command.CommandText);
        }

        void IDbCommandInterceptor.ScalarExecuted(System.Data.Common.DbCommand command, DbCommandInterceptionContext<object> interceptionContext)
        {
            SendToClient(command.CommandText);
        }

        void IDbCommandInterceptor.ScalarExecuting(System.Data.Common.DbCommand command, DbCommandInterceptionContext<object> interceptionContext)
        {
            SendToClient(command.CommandText);
        }

        void SendToClient(string sql)
        {
            HubCaller.Invoke<LoggingHub>(_c => _c.Clients.All.onSql(sql));
        }
    }
}

The above interface gives us access to more than than just sql statements so the possibilities for adding to this class are endless. However, let us just keep it simple for now. Once registered with entity framework, the above class will send the command text of all DbCommands it receives to the client. There are several issues with the current implementation which we can fix later. The first is we assume all CommandText is sql. Another is we are sending messages to everyone instead of just the current user.

Next we will create an Entity Framework Code-First database and a client page to initiate queries so we have something to log.

Entity:

namespace RealTimeLogging
{
    public class Person
    {
        [DatabaseGenerated(DatabaseGeneratedOption.Identity)] 
        public int PersonID { get; set; }

        [StringLength(50)]
        public string FirstName { get; set; }

        [StringLength(50)]
        public string LastName { get; set; }

        public int Age { get; set; }
    }
}

Context:

namespace RealTimeLogging
{
    public class PersonContext : DbContext
    {
        public DbSet<Person> People { get; set; }
    }
}

Initializer:

namespace RealTimeLogging
{
    public class DbInitializer : DropCreateDatabaseAlways<PersonContext>
    {
        protected override void Seed(PersonContext context)
        {
            context.People.Add(new Person
            {
                FirstName = "John",
                LastName = "Doe",
                Age = 55

            });

            context.People.Add(new Person
            {
                FirstName = "Jane",
                LastName = "Smith",
                Age = 90

            });

            context.SaveChanges();
        }
    }
}

Db config where initializer and interceptor is registered with entity framework.

namespace RealTimeLogging
{
    public class DbConfig : DbConfiguration
    {
        public DbConfig()
        {
            this.SetDatabaseInitializer<PersonContext>(new DbInitializer());
            this.AddInterceptor(new StatementLogger());
        }
    }
}

Finally, the DbContext:

namespace RealTimeLogging
{
    [DbConfigurationType(typeof(DbConfig))]
    public class PersonContext : DbContext
    {
        public DbSet<Person> People { get; set; }
    }
}

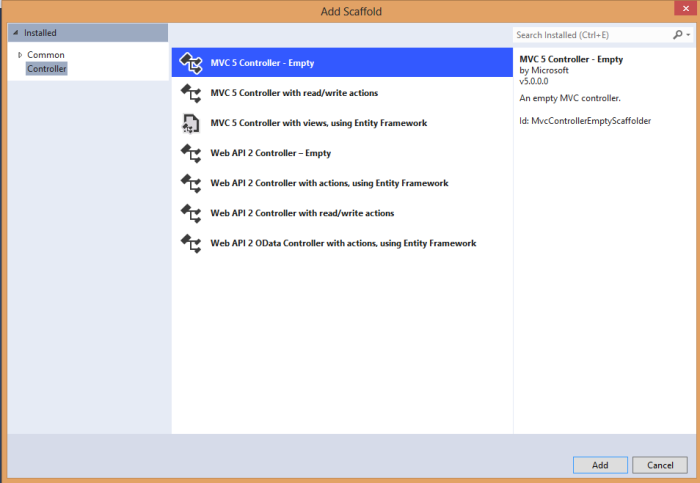
Next add an empty MVC 5 controller
new controller

Create a new view for the index action in the controller:
Add view

In RouteConfig.cs change the default controller action from “Home” to “Person”.

namespace RealTimeLogging
{
    public class RouteConfig
    {
        public static void RegisterRoutes(RouteCollection routes)
        {
            routes.IgnoreRoute("{resource}.axd/{*pathInfo}");

            routes.MapRoute(
                name: "Default",
                url: "{controller}/{action}/{id}",
                defaults: new { controller = "Person", action = "Index", id = UrlParameter.Optional }
            );
        }
    }
}

Next include the SingalR client script and a section for views to inject scripts at the bottom of _Layout.cshtml.

    <script src="~/Scripts/jquery-2.0.3.min.js"></script>
    <script src="~/Scripts/bootstrap.min.js"></script>
    <script src="~/Scripts/jquery.signalR-2.0.1.min.js"></script>
    @RenderSection("scripts",false)
</body>
</html>

At this point you should be able to run the mvc web application. You can find any missing “using” statements by right clicking classes and selecting the “Resolve” option. Once you have verified that the application can build we will create some controller actions and client side javascript which will interact with our database.

Replace the contents of Views/Person/Index.cshtml with the following:


@{
    ViewBag.Title = "Index";
}

<h2>Index</h2>
<button id="btnFirstPersonName">Name of First Person</button> <span id="FirstPersonName"></span><br /><br />
<button id="btnNumberOfPeople">Number of people</button> <span id="TotalPersons"></span>

@section scripts 
{
    <script type="text/javascript">
        $(function () {

            $('#btnFirstPersonName').click(function () {
                $.ajax({
                    url: '@Url.Action("FirstPersonName","Person")',
                    type: 'POST'
                }).done(function (data) {
                    $('#FirstPersonName').text(data);
                });
            });

            $('#btnNumberOfPeople').click(function () {
                $.ajax({
                    url: '@Url.Action("NumberOfPeople","Person")',
                    type: 'POST'
                }).done(function (data) {
                    $('#TotalPersons').text(data);
                });
           });

        });
    </script>

}

Change the PersonController class to look like the following:

    public class PersonController : Controller
    {
        PersonContext context = new PersonContext(); 
        //
        // GET: /Person/
        public ActionResult Index()
        {
            return View();
        }

        public JsonResult FirstPersonName()
        {
            var firstPerson = context.People.FirstOrDefault();
            return Json(firstPerson.FirstName + " " + firstPerson.LastName);
        }

        public JsonResult NumberOfPeople()
        {
            var numPeople = context.People.Count();
            return Json(numPeople);
        }
   }

At this point, if you run the app and press the two buttons your app should look like the following:
app working

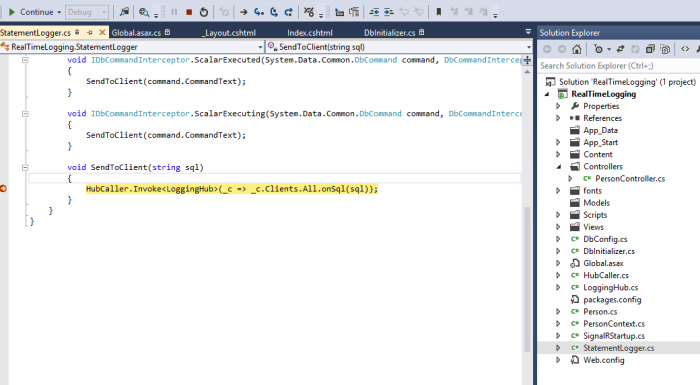
Testing the Interceptor
Set a breakpoint inside the “SendToClient” method and click one of the buttons again. The app should stop at the breakpoint just like mine did. There will be several statements coming through here so you can keep going through to see the sort of commands Entity Framework sends to the database.

Logger debug

This concludes the first post which covered:

  • Creating a basic Asp.net MVC 5 application
  • Adding SignalR for transferring log data in real time
  • Entity Framework using Code First for our database
  • The new interceptor API for getting sql statements from Entity Framework
  • Setting up a basic page to call some controller actions which will query the database

The code used in this post can be found on Github. The next post will cover creating the dev tools extension which will display the log information.

C# datatables parser


The jQuery Datatables plugin is a very powerful javascript grid plugin which comes with the following features out of the box:

  • filtering
  • sorting
  • paging
  • jQuery ui themeroller support
  • plugins/extensions
  • Ajax/Remote and local datasource support

Setting up datatables on the client is very simple for basic scenarios. Here is an example of the markup and the initialization code.

<table id="PeopleListTable">
  <thead>
    <tr>
      <th>Name</th>
      <th>Age</th>
   </tr>
  </thead>
  <tbody>
    <tr>
      <td>John Doe</td>
      <th>25</th>
    </tr>
  </tbody>
</table>
$(function(){
  $('#PeopleListTable').dataTable();
});

Server Side Processing
The Datatables plugin supports loading table data, paging, sorting and filtering via ajax. Datatables sends a specific set of parameters which the server is expected to process and return the result in json format. Here is a sample of the request parameters sent via ajax:

sEcho:35
iColumns:7
sColumns:
iDisplayStart:0
iDisplayLength:10
mDataProp_0:FirstName
mDataProp_1:LastName
mDataProp_2:BirthDateFormatted
mDataProp_3:BirthDate
mDataProp_4:Weight
mDataProp_5:Height
mDataProp_6:Children
sSearch:
bRegex:false
sSearch_0:
bRegex_0:false
bSearchable_0:true
sSearch_1:
bRegex_1:false
bSearchable_1:true
sSearch_2:
bRegex_2:false
bSearchable_2:true
sSearch_3:
bRegex_3:false
bSearchable_3:true
sSearch_4:
bRegex_4:false
bSearchable_4:true
sSearch_5:
bRegex_5:false
bSearchable_5:true
sSearch_6:
bRegex_6:false
bSearchable_6:true
iSortCol_0:1
sSortDir_0:asc
iSortingCols:1
bSortable_0:true
bSortable_1:true
bSortable_2:true
bSortable_3:true
bSortable_4:true
bSortable_5:true
bSortable_6:true

For a detailed description of each parameter please see the datatables.net documentation

mDataProp_n Parameters
Datatables supports displaying columns in any order in the table by setting the mProp property of a column to a specific property in the json result array. For each column, it sends a parameter in the format ‘DataProp_columnIndex = propertyName’. As we can see in our example above, FirstName is the mProp of the first column in the table. It is important to understand these column index property mappings because the sorting and filtering parameters rely on them being interpreted properly.

Sorting
Datatables has a global setting called bSort which disables sorting for the entire table. It also has a property called bSortable which enables/disables sorting for a specific column. For each column, the server side script should search for a parameter in the format ‘bSortable_columnIndex = true/false’. Sorting is determined by parameters with the formats ‘iSortCol_sortCount = columnindex’ and ‘sSortDir_sortCount = asc’ where ‘sortCount’ is the order of sorted parameters and ‘asc’ is the direction that the specific column should be sorted.

Filtering
Datatables has a global setting called bFilter which disables filtering for the entire table. It also has a property called bSearchable which enables/disables filtering for a specific column. For each column, the server side script should search for a parameter in the format ‘bSearchable_columnIndex = true/false’. Filtering works by searching all the searchable columns in a row for any value which contains the filter value in the format ‘sSearch = findMe’. There is also support for filtering on specific columns by using the parameters in the format ‘sSearch_columnIndex = findMe’.

The c# Datatables Processor
The parser is a generic class with implements most of the server side features of the Datatables plugin in a reusable manner with special emphasis on performance. For example, an application which requires grids for people, cities and shopping lists does not require special logic for sorting and filtering each entity type because Datatables dynamically generates the expressions required to support these functions. If our first client side example was configured to use server side processing it would probably look like this:

 <table id="PeopleListTable"></table>
        $(function () {
            var peopleList = $('#PeopleListTable').dataTable({
                bServerSide: true,
                bProcessing: true,
                sServerMethod: "POST",
                sAjaxSource: "@Url.Action("All", "Person")",
                aoColumns: [
                    { mData: "FirstName", sTitle: "First Name" },
                    { mData: "LastName", sTitle: "Last Name"}
                ]
            });
        });
public JsonResult All()
{
    var context = new PeopleEntities();
    var parser = new DataTablesParser<Person>(Request, context.People);

    return Json(parser.Parse());
}

With the above combination of markup, javascript and 3 lines of server side code you have the ability to render a very rich and responsive grid in little time.

Entity Framework Performance
The parser supports two separate scenarios which are determined by the provider of the Iqueryable supplied to its constructor; The simple case where all/most processing is handled in memory via Linq to Objects and the more complex case where most/all processing is handled on the database server via Linq to SQL. In linq to sql support we ensure all the expressions sent to entity framework are translatable to valid tsql statements. The goal here is to avoid the cost of bringing most/all the data across the wire and into memory for processing. Imagine a grid for a dataset with 2 million records where you pull in all 2 million records from the database only to send 10 to the client.

As an example the following sql statement should be the result of the request it precedes. All the sorting, filtering and paging parameters have been translated and are represented in the tsql statement.

  SELECT TOP (10) [Filter1].[Id] AS [Id], 
                 [Filter1].[FirstName] AS [FirstName], 
                 [Filter1].[LastName] AS [LastName]
 FROM ( SELECT [Extent1].[Id] AS [Id], 
               [Extent1].[FirstName] AS [FirstName], 
               [Extent1].[LastName] AS [LastName], 
               row_number() OVER (ORDER BY [Extent1].[FirstName] ASC) AS [row_number]
               FROM [dbo].[People] AS [Extent1]
               WHERE ([Extent1].[FirstName] LIKE N'%john%') 
                     OR ([Extent1].[LastName] LIKE N'%john%')\r\n)  AS [Filter1]
 WHERE [Filter1].[row_number] > 0
 ORDER BY [Filter1].[FirstName] ASC
sEcho:35
iColumns:7
sColumns:
iDisplayStart:0
iDisplayLength:10
mDataProp_0:FirstName
mDataProp_1:LastName
sSearch: john
iSortCol_0:1
sSortDir_0:asc

The ‘iDisplayStart’ property determines the start of a page of data and iDisplayLength determines the length of each page of data.

Where is X feature?
The biggest feature missing from the parser is processing individual search filters. Originally, the individual property search and the generic search were implemented as two separate functions. However, I am convinced that the bulk of the logic in the generic search can be generalized to also handle the individual property such. I am open to any ideas on this one. I have also been asked about sorting/filtering on sub properties. This should be possible in linq to objects but I have not been able to look into it.

Conclusion
The parser is definitely a work in progress in the sense that it is always being improved whenever possible but it certainly saves time when using the datatables plugin for grids.

The parser can be added to your project via npm using the following command:

PM> Install-Package DataTablesParser

Please note that the NPM version up until the publishing of this post does not have the most up to date fixes and changes. I plan to update the NPM package as soon as the new changes have been thoroughly tested.

You can get the latest code or send pull requests at the github repository here:
https://github.com/garvincasimir/csharp-datatables-parser

Extension method for converting generic lists to CSV in C# [Updated]


Over a year ago I published a post which showed a c# extension method which can be use to convert a generic  list to CSV. Recently, I came across a problem in the code. It does not handle Nullable<T> properly. The following is an update to the code which fixes the Nullable<T> issues. I also added a cheap option which converts camel case headers to distinct words.

public static string ToCSV<T>(this IEnumerable<T> list, bool showheader = true, bool processHeaders = false)
 {
 var type = typeof(T);
 var properties = type.GetProperties();

//Setup expression constants
 var param = Expression.Parameter(type, "val");
 var doublequote = Expression.Constant("\"");
 var doublequoteescape = Expression.Constant("\"\"");
 var comma = Expression.Constant(",");

//Convert all properties to strings, escape and enclose in double quotes
 var propq = (from prop in properties
 let tostringcall = Expression.Call(typeof(Convert).GetMethod("ToString", new Type[] { typeof(object) }), Expression.Convert( Expression.Property(param, prop), typeof(object)))
 let replacecall = Expression.Call(tostringcall, typeof(string).GetMethod("Replace", new Type[] { typeof(String), typeof(String) }), doublequote, doublequoteescape)
 select Expression.Call(typeof(string).GetMethod("Concat", new Type[] { typeof(String), typeof(String), typeof(String) }), doublequote, replacecall, doublequote)
 ).ToArray();

//Convert an instance of the object to a single csv line
 var concatLine = propq[0];
 for (int i = 1; i < propq.Length; i++)
 concatLine = Expression.Call(typeof(string).GetMethod("Concat", new Type[] { typeof(String), typeof(String), typeof(String) }), concatLine, comma, propq[i]);

var method = Expression.Lambda<Func<T, String>>(concatLine, param).Compile();

if (showheader)
 {
 //Create header row
 var header = String.Join(",", properties.Select(p => processHeaders ? Regex.Replace(p.Name, "(\\B[A-Z])", " $1").Trim() : p.Name).ToArray());

return header + Environment.NewLine + String.Join(Environment.NewLine, list.Select(method).ToArray());
 }
 else
 {
 return String.Join(Environment.NewLine, list.Select(method).ToArray());
 }
 }

Extension method for converting generic lists to CSV in C#


I created the following class so I could easily convert a generic list to a CSV string.  This may be handy when you want to quickly export a moderately sized result set to Microsoft Excel.

    public static class CsvConverter
    {
        public static string ToCSV<T>(this IEnumerable<T> list)
        {
            var type = typeof(T);
            var props = type.GetProperties();

            //Setup expression constants
            var param = Expression.Parameter(type, "x");
            var doublequote = Expression.Constant("\"");
            var doublequoteescape = Expression.Constant("\"\"");
            var comma = Expression.Constant(",");

            //Convert all properties to strings, escape and enclose in double quotes
            var propq = (from prop in props
                         let tostringcall = Expression.Call(Expression.Property(param, prop), prop.ReflectedType.GetMethod("ToString",new Type[0]))
                         let replacecall = Expression.Call(tostringcall, typeof(string).GetMethod("Replace", new Type[] { typeof(String), typeof(String) }), doublequote, doublequoteescape)
                         select Expression.Call(typeof(string).GetMethod("Concat", new Type[] { typeof(String), typeof(String), typeof(String) }), doublequote, replacecall, doublequote)
                         ).ToArray();

            var concatLine = propq[0];
            for (int i = 1; i < propq.Length; i++)
                concatLine = Expression.Call(typeof(string).GetMethod("Concat", new Type[] { typeof(String), typeof(String), typeof(String) }), concatLine, comma, propq[i]);

            var method = Expression.Lambda<Func<T, String>>(concatLine, param).Compile();

            var header = String.Join(",", props.Select(p => p.Name).ToArray());

            return header + Environment.NewLine + String.Join(Environment.NewLine, list.Select(method).ToArray());
        }
    }

Adding this as an extension method for IEnumerable may not be the best thing since the above will fail if T is an object with no properties. However, you probably wouldn’t be converting something like a List of string to CSV anyways. If you are then you can simply use the following code

var csv = string.join(",",list.ToArray());  

The following console application sample demonstrates how the new method can be used. I hope someone finds this useful.

   class Program
    {
        static void Main(string[] args)
        {
            var list = new List<person>();
            var limit = 100;

            for (int x = 0; x < limit; x++)
            {
                var fname = "Ron";
                var lname = "Obvious";

                list.Add(new person()
                {
                    Age = x,
                    FirstName = fname,
                    LastName = lname
                });

            }
         
            var csv = list.ToCSV();

            Console.Write(csv);
            Console.ReadLine();

        }
    }

    class person
    {
        public int Age { get; set; }
        public string FirstName { get; set; }
        public string LastName { get; set; }
    }

jQueryUi Dialog Search using knockoutjs


This is a followup to a post I wrote about using a jQueryUi dialog as a popup search with a filter. I decided to convert the example to use knockoutjs for the data bindings. The following is what I came up with.

Markup:

</pre>
<div id="SearchDialog">
<div class="SearchTitle">
<div class="SearchTitleText">Search Friends</div>
<div class="SearchTitleFilterButton">Filter:
 <input class="SearchFilter" type="text" data-bind='value: filter, valueUpdate: "afterkeydown"' />
 <button class="SearchButtonClose"></button></div>
<div class="SearchClear"></div>
</div>
<div class="SearchContent" data-bind="foreach: filteredFriends"></div>
<div data-bind="visible: filteredFriends().length == 0">No Results</div>
</div>
<pre>

In the above note the new data-bind attributes which knockoutjs uses to perform its magic. It now handles both updating of the DOM and the keyboard events which trigger the filtering.

The Javascript:


        $(function(){
            $('#SearchDialog').dialog({
                    width: 500,
                    create: function () {
                        //Get a reference to jquery ui generated element

                        var widget = $(this).dialog('widget');
                        //Get a reference to content div
                        var dialog = $(this);
                        //Delete the default jquery ui title bar
                        widget.find('.ui-dialog-titlebar').remove();

                        //Remove the default padding values for the popup
                        widget.css('padding', 0).find('.ui-dialog-content').css('padding', 0);

                        //Use jquery ui styling for our new titlebar
                        $('.SearchTitle',dialog).addClass('ui-widget-header');

                        //Position title elements
                        $('.SearchTitleText',dialog).css('float','left');
                        $('.SearchTitleFilterButton',dialog).css('float','right');
                        $('.SearchClear',dialog).css('clear','both');

                        //Create a close button and allow it to close the popup
                        $('.SearchButtonClose',dialog).button({
                            icons: { primary: 'ui-icon-close' },
                            text: false
                        }).css('width', 16)

                        .click(function () {
                            dialog.dialog('close');
                        });

                    }

            });

            var friendsModel = function(){
                var self = this;

                self.friends = ko.observableArray([]);
                self.filter = ko.observable("");
                self.select = function(n){
                    alert('Hello I am ' + n);
                };

                self.filteredFriends = ko.computed(function() {
                	var filterText = self.filter().toLowerCase();
                	return ko.utils.arrayFilter(self.friends(), function(item) {
                   			return filterText.length < 1 || item.toLowerCase().indexOf(filterText)!=-1
               	    });

               }, self);

                //Load Json when model is setup
                self.dummyCompute = ko.computed(function() {
                    $.getJSON("friends", function(data) {
                    		self.friends(data);
                 	 });

                }, self);
            };

            ko.applyBindings(new friendsModel());

        });

In this example I decided to show how the data can be populated using ajax so I added a special computed observable which has the effect of loading the json array once the model is bound. Here is the java servlet code which returns the json data.


public class FriendList extends HttpServlet {
	public void doGet(HttpServletRequest req, HttpServletResponse resp) throws IOException {
		String[] friends = new String[] {"John","Bob","Jones","Tessa","Anna","Casper","Ed","Francis","Greg","Hanna","Ivan"};
		Gson gson = new Gson();
		String jsonString = gson.toJson(friends);
		resp.setContentType("application/json");
		resp.getWriter().print(jsonString);
	}

}

If you are wondering why I am using java it is because my samples are hosted in google app engine. The live example for this post can be found here. Also, the non ajax example using knockoutjs can be found here.